The Water Quality in Cape May, New Jersey and Its Effects on Bottlenose Dolphins
The Water Quality in Cape May, New Jersey and its Effects on Bottlenose Dolphins
Mary Jacketti
Intern at Cape May Whale Watch and Research Center, University of Miami
Abstract
The purpose of this study was to determine if the Atlantic Ocean or Delaware Bay in Southern New Jersey was clean or polluted. We looked at different parameters of the water quality to see if runoff or carbon emissions had any impact on the bottlenose dolphins that return back to Cape May every year. When either on the American Star or the Atlantic Star, I would take samples of the water after every dolphin sighting. I used the tests strips to test the amounts of nitrites, nitrates, alkalinity, and pH of the ocean. The idea was to see if there was any unusual water quality data and if so, would it have an effect on the bottlenose dolphins. The alkalinity seemed to be the most unusual and changed most often. The oceans keep becoming more and more polluted and a lot more runoff is entering into the water. Even if the alkalinity and pH aren’t too low yet, they will in the years to come and will eventually have a large effect on marine mammals.
Introduction
In recent years, the world’s oceans, rivers, and bays have been going through nitrification, ocean acidification, and aquatic hypoxia. Nitrification is the biological process that oxidizes ammonia or ammonium to nitrite and then to nitrate. Ammonia is produced from the marine life breaking down proteins into biological waste. The ammonia is then converted to less toxic nitrite from the bacteria in the water and then converted again to much less toxic nitrate. Ocean acidification occurs when too much carbon dioxide is absorbed by seawater. The excess CO2 reduces the pH and alkalinity of the seawater. Algae and seagrasses may benefit from ocean acidification because they require CO2 to live. However, calcifying species such as coral reefs, sea urchins, and oysters are becoming at risk. Hypoxia is the term that describes an oxygen depletion in the ocean, river, or bay. When the water becomes hypoxic, it is unable to sustain life and more and more parts of the ocean are becoming dead zones. Hypoxia can occur from limited vertical mixing of the 3 layers of the water. It most often occurs from too many nutrients such as nitrogen and phosphorous being dumped into the water or entering from runoff. Nitrification, ocean acidification, and hypoxia are only a few of the many problems that our oceans are facing.
I chose a research project that would be able to relate to the issues that the ocean is facing. I wanted to determine whether the waters in Southern New Jersey were clean and nutrient rich and if they weren’t, would the poor parameters have an effect on dolphin behaviors. The dolphins that we see in South New Jersey are Atlantic Bottlenose Dolphins. They migrate to Cape May every year during the warmer months to mate and give birth. On every dolphin and whale watching trip, we would record data on the marine life that we saw. Any time we would spot a dolphin, we would record any noticeable behaviors. This experiment entailed trying to see if there was a correlation between the water quality of the ocean and the dolphins’ behaviors and their feeding habits.
I expected to find the water in South New Jersey to be a lot less clean. I was expecting the nitrate and nitrite concentration to be very high and the pH to be very low. I was also expecting the alkalinity of the ocean to already be lower than average due to ocean acidification. The pH, nitrate, and nitrite concentrations didn’t seem to change too often and were what is expected of a clean saltwater aquarium. However, the alkalinity seemed to change more often and there were a few outliers. Overall, my theory was incorrect and the water was cleaner than I anticipated.
Method
For this experiment, we took a sample of the water almost every time I was present for a dolphin sighting. These sightings occurred anywhere from the Delaware Bay in West Cape May, to the shores of Wildwood. The times that these samples were taken differed each day depending on if I was on the boat for the 10:00AM, 13:00PM, or 18:00PM trip.
Instruments
The instruments that were used for this trip were a cut gallon sized apple juice bottle, string, saltwater aquarium test strips, a GPS, a data sheet, and the Atlantic Ocean/Delaware Bay. The apple juice bottle was cut in half to resemble a small bucket. A hole was cut in the bottle so we were able to tie a string to it. The saltwater aquarium test strips had small patches that measured the nitrates, nitrites, alkalinity, and pH of the water and would change color.
Procedures
Every time there was a dolphin sighting, we would enter the exact start time, start latitude, start longitude, water temperature, and depth right away. Then, we would take photographs of the dolphins in order to get the best shot of each dorsal fin for photo identification. At the end of a sighting, we would record the end time, end latitude, end longitude, any significant behaviors the dolphins were displaying, whether they were feeding or mating, and how many calves and juveniles were present. However, after taking the photographs and before entering the data, I would quickly grab my apple juice bottle and throw it over the side of the boat, let the water fill up and then pull it back up. Then, the data was entered and afterwards I would quickly place the test strip into the sample of water. After thirty seconds, I would compare the color of the test strip to all the possible colors for each parameter. This same procedure occurred every time we would stop on a group of dolphins when I was on the trip.
Results
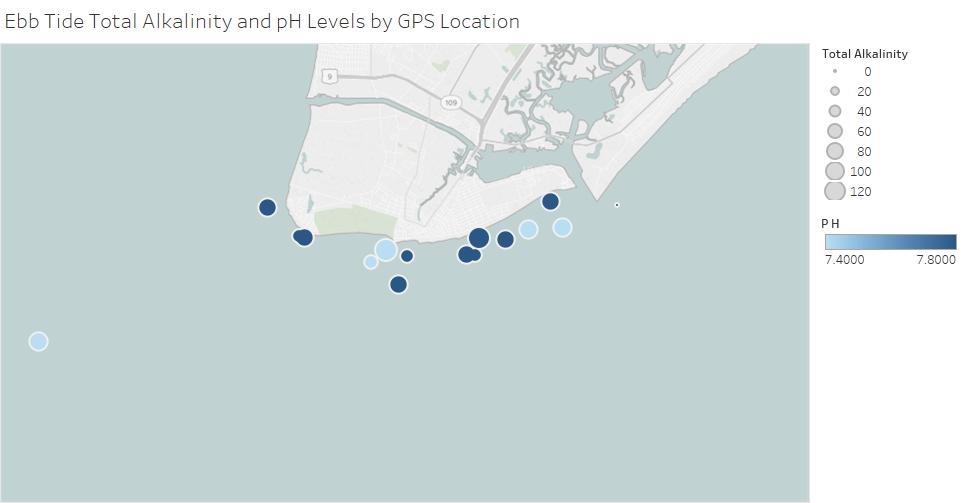
The first graph shows pH and alkalinity at each sighting during ebb tide. Ebb tide is when the tide is going out and heading to low tide. The size of the circle represents the total alkalinity of the water from that sighting and the color of the circle represents the pH of the water. All of these sightings are close to shore, except for one that is farther offshore in the Delaware Bay.

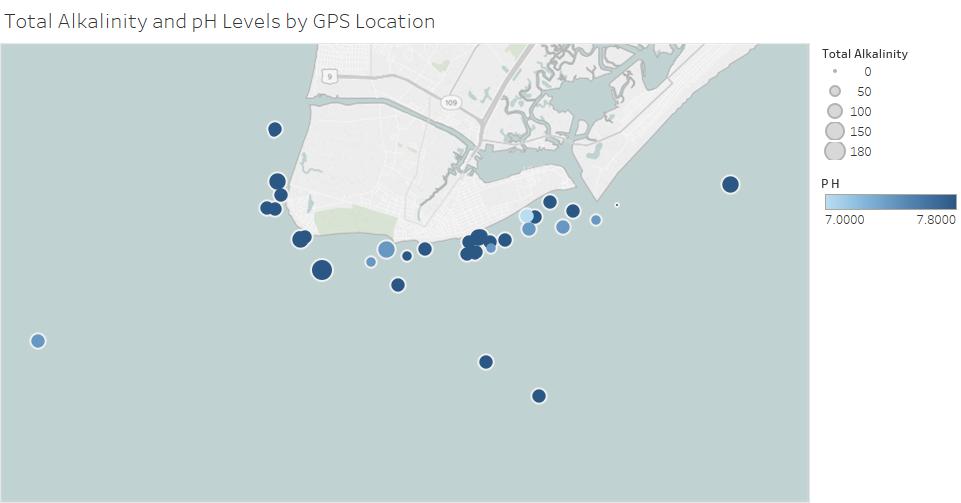
This graph below shows the alkalinity and pH at each sighting during flood tide. Flood tide is when the tide is heading to high tide and slowly rising. This graph is the same as the first graph with the color and size of the circles describing the values we got from each sample. Most of these values are from close to shore sightings, except for a few offshore sightings in the Atlantic Ocean.

This graph below is a compilation of both the graphs above. It shows the total alkalinity and pH from every sample taken this summer.

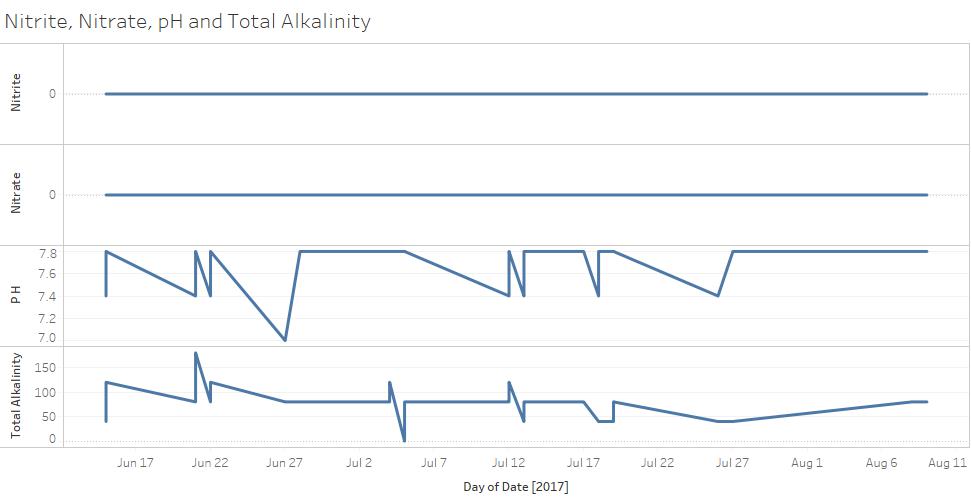
The graph below shows the values we got for the nitrates, nitrites, alkalinity, and pH for every sighting this summer. As you can see, the nitrates and nitrites were consistently zero while the pH and alkalinity seemed to jump from value to value every sighting.

This graph shows the average water temperature, pH, and alkalinity from each sighting this summer. You can see that the water temperature steadily increased and the pH seemed to be more consistent than the alkalinity.
Discussion
It is desired for the ocean to not have any levels of nitrates or nitrites in it. However, it is very unlikely for that to happen. Nitrates and nitrites mostly come from ammonia and all animals produce ammonia when they break down proteins. Rotting food and dead fish also produce ammonia. The bacteria in the ocean will then convert the ammonia to nitrite and then again to nitrate. The Atlantic Ocean and Delaware Bay most likely had some levels of nitrites and nitrates, but were so small they could not be detected from my test strips. If any body of water has too much nitrates or nitrites, it will make it difficult for marine life to live. Algae and other oceanic plants use nitrates as a source of food. If the algae have an unlimited amount of food, it will continue to grow. An excess amount of algae will cause a depletion in the oxygen in the water. This will in turn cause smaller organisms to die, then the smaller fish that eat small organisms will die and so on, causing bigger and bigger fish to eventually die. This can affect the dolphins because too much algae will eventually cause the bunker or crustaceans that they eat to die, causing the dolphins to starve and then die themselves. Dolphins recently have also been found to have high levels of nitric oxide in their breath more after eating than after fasting for 12 hours. Having higher levels on nitric oxide in the bottlenose dolphins’ breath was also linked to having shorter breath hold duration. It is a good thing that the waters of Southern New Jersey did not have high levels of nitrites and nitrates in them so our bottlenose dolphins are not harmfully affected.
The alkalinity of the water every time we sampled it was in the “not desired” range. The ideal range for alkalinity in a saltwater environment is from 180-300 parts per million (ppm). The alkalinity was usually closest to 80 ppm, but there were a few times it got as low as 40 ppm or as high as 120 ppm. The pH of our samples was also a bit too low than desired. The ideal pH in a saltwater environment is 8.4. However, got 7.8 most of the time, while occasionally getting a value of 7.0 or 7.4. I believe the reason the alkalinity and pH were both too low is due to ocean acidification. Ocean acidification is when carbon dioxide is absorbed by seawater and chemical reactions occur that reduce seawater pH, carbonate ion concentration, and saturation states of biologically important calcium carbonate minerals. Most skeleton and shells of marine organisms are composed of calcium carbonate minerals. Ocean acidification is causing a depletion in these minerals and therefore, affecting the ability of some organisms to produce and maintain their shells. This can affect oysters, clams, sea urchins, plankton, and coral. Like nitrification, ocean acidification will eventually have an effect on the bottlenose dolphins in the Southern New Jersey area. Bottlenose dolphins sometimes go to the ocean floor to eat clams and oysters and if acidification is harming the crustaceans, it is also indirectly harming the dolphins. Also, the food chain will be affected and the fish that eat the clams and oysters will not have any food causing a drop in their population and the same will happen to the dolphins. “Estimates of future carbon dioxide levels, based on business as usual emission scenarios, indicate that by the end of this century the surface waters of the ocean could be nearly 150 percent more acidic, resulting in a pH that the oceans haven’t experienced for more than 20 million years” (NOAA 1). So far, from the data that we collected, it looked as if the dolphins were not affected yet. They still seemed to be feeding at normal rates and holding their breath for longer durations. If the US and surrounding countries continue to emit high levels of carbon, the oceans are going to turn more and more acidic. Eventually, the dolphins are going to experience a depletion in their food sources.
Conclusion
Before starting this experiment, I was convinced that the waters around Cape May were going to be filthy and have high levels of both nitrates and nitrites due to runoff. However, I was very wrong. It eased my mind to know that a lot of rivers, bays, and oceans are still relatively clean even though the human population keeps polluting them. The water still contains high levels of oxygen and houses many healthy different species of marine life. For future research, I would like to assess if dolphins and other marine mammals are being affected in different parts of the world. Even though the Atlantic Ocean is clean in New Jersey, it may be a lot dirtier somewhere else. To keep the waters clean, we as a whole need to find ways to stop emitting so much carbon and properly recycle more of our garbage.
References
Gallant, Micah. “Nitrates and Their Effect on Water Quality – A Quick Study.” Wheatley River
Improvement Group, Partnership For Environmental Education and Rural Health,
www.wheatleyriver.ca/media/nitrates-and-their-effect-on-water-quality-a-quick-study/.
Kroeker, Kristy J., et al. “Impacts of Ocean Acidification on Marine Organisms: Quantifying
Sensitivities and Interaction with Warming.” Global Change Biology, vol. 19, no. 6, Mar. 2013, pp. 1884–1896., doi:10.1111/gcb.12179.
US Department of Commerce, National Oceanic and Atmospheric Administration. “Hypoxia.”
NOAA’s National Ocean Service, 6 Oct. 2014, www.oceanservice.noaa.gov/hazards/hypoxia/.
“What Is Ocean Acidification?” PMEL Carbon Program,
www.pmel.noaa.gov/co2/story/What+is+Ocean+Acidification%3F.
Yeates, Laura C., et al. “Nitric Oxide in the Breath of Bottlenose Dolphins: Effects of Breath
Hold Duration, Feeding, and Lung Disease.” Marine Mammal Science, vol. 30, no. 1,
2013, pp. 272–281., doi:10.1111/mms.12037.
